Overview
The Humane Project was created based on a project where an infographic based on a subject of our choice was needed. The topic chosen was animal cruelty, leading to the creation of The Humane Project: Combatting and Preventing Animal Cruelty.
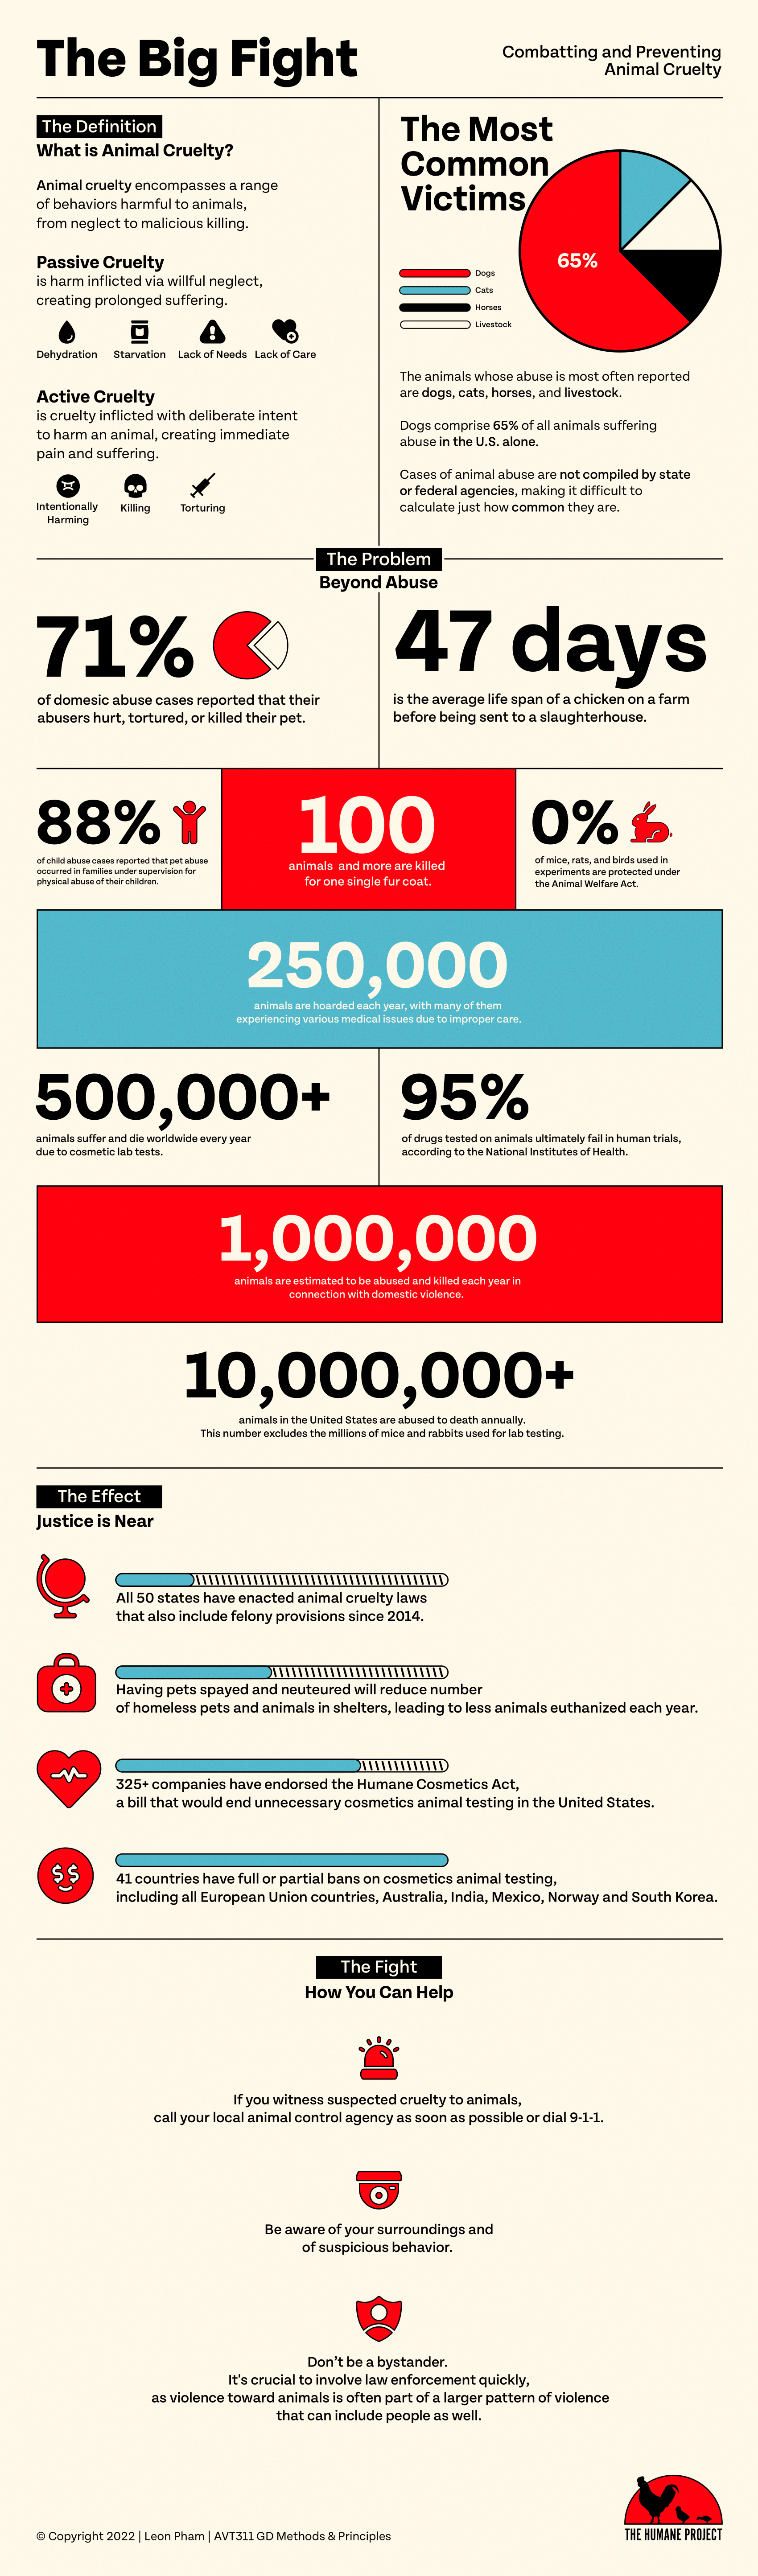
As the information based on the topic of animal cruelty is quite heavy in terms of subject matter, as well as statistics, the infographic was broken into grids for efficient digestibility. The use of icons and bright colors help alert the readers while also maintaining a sense of camaraderie.
One of the many problems that infographics -- based on heavier topics such as animal abuse --face is that their overall design choice reflect the cruel nature of the subject matter. They are often red and alarming, utilizing real photographs of animal abuse to inform the public. While it is extremely effective in telling the message, I didn't want to rely on shock value to tell the public that animal cruelty was bad. Most, if not almost all, people know that, and consider it common sense. However, many do not read the statistics on how it can be more than physical abuse, or the numbers of animals that suffer every year, due to the shocking nature of the photographs used being the spotlight of the infographics.
In turn, I opted for a grid-based design that allowed typography, charts, and icons to be the main carrier of the intense subject matter.